SKIL in Pinch Technology
[Click here for on line ASSBT Paper:  ] ]
[Click here for zip of SIT Paper:  ] ]
BACKGROUND
Pinch technology is a relatively modern engineering tool developed in the late 1970's and early 1980's. This new approach to evaluating the energy requirements of a site quickly identified ways of improving the overall energy use. The name "pinch technology" was applied because the technique identified the point or points in the energy flow where restrictions applied and hence limited one's ability to re-use low grade energy.
The major difference between this new technology and previous engineering approaches was the formalised methodology involving the rigorous application of thermodynamic principles. Pinch technology was initially adopted by major chemical companies and the petrochemical energy. Beet sugar was quite quick to adopt it because of the industry's energy profile and it is now being adopted by the cane industry too.
APPLICATION
Pinch technology is equally applicable to greenfield projects and refurbishments. In either case the objectives are to achieve:
- minimum energy consumption
- optimisation of utilities
- minimum capital expenditure to achieve these
Minimising energy consumption implies minimising cooling water requirements too because all of the energy used ultimately has to be rejected again in some low grade form.
The technology's strengths are its overall approach to process integration (rather than optimising a single station) and its blend of thermodynamics with commercial requirements. It also takes into account the operational requirements of the site and does reduce flexibility or availability.
THE SUGAR INDUSTRY
The application of pinch technology in the beet sugar industry is reaching maturity and most important sectors of that industry would see it as a norm for plant optimisations and new projects. The cane sugar industry is only just adopting it.
SKIL's normal approach to the application of pinch technology to existing operations is two phased: undertake an energy audit of the site followed by detailed analysis of opportunities identified in the audit.
Phase I: Audit
The audit phase would typically involve about one week of work at the site for a small team, usually 2 or 3 engineers. During the visit, the team will investigate a variety of issues and identify a series of small potential projects to achieve the objectives. Following some necessary desk work, indicative returns will be presented based on preliminary cost estimates.
Phase II: Implementation
Once the Client has reviewed the potential projects and is confident of reasonable returns, the Phase II work will undertake a full pinch analysis in co-operation with the factory staff and establish a programme for the projects with fully justified returns. The involvement of the factory staff is important to the success of the analysis because only they can inject the requirements of operational flexibility and operability.
The results of the Phase II analysis provide the Client with all the information needed to undertake detailed design and to implement the project in whichever way is selected. Because the returns are frequently significant, as discussed below, an informal reporting as the work progresses allows almost instant benefits to be gained from the analysis.
PRACTICAL RETURNS
The returns from pinch technology projects are surprisingly substantial when the maturity of the sugar industry and its level of integration is considered. A few examples serve to demonstrate the point:
- $½ million savings, 0.7 years pay-back
- $4 million savings, 0.3 years pay-back
- $½ million savings, 1.3 years pay-back
Such returns indicate that owners should not automatically assume that their sugar factories are already fully optimised.
A paper given by one of SKIL's Directors to the 1999 American Society of Sugar Beet Technologists Convention is reproduced below.
Reducing Energy Consumption in beet factories:
The European experience and its application to North America.
Phil Thompson C.Eng. M.I.Chem.E., Sugar Knowledge International Ltd, UK
1. Introduction
The last 20 years have seen the energy consumption of European beet sugar factories fall dramatically, by at least 50%. This reduction was stimulated by the oil price rises of the late 70s and early 80s, but has continued as companies seek to minimise operating costs. More recently the pressures of environmental legislation and fuel taxation have maintained the impetus.
This paper outlines the changes made in Europe, and explores whether they are applicable to the economic and meteorological climate of North America. My objective is to understand whether the lower fuel costs and ambient temperatures justify the higher energy consumption, or whether N America is just at the beginning of an energy saving journey that Europe has already travelled.
2. European Performance
Most factories operate with steam consumption in the range 20 - 30 % on beet. The leading factories such as Klein Wanzleben are designed for around 17 % beet and various studies have suggested that 14 - 15 % beet represents the theoretical minimum using proven technologies. ["Energy Saving Possibilities in the Sugar Industry", H Wunsch, Sugar y Azucar, January 1998]
Electrical power consumption is typically 24 - 29 kWh per short ton of beet, including drying and pelleting of pulp. Most factories are self sufficient in power and significant number export electricity to generate additional revenue.
Typical fuel consumption for process steam (25% on beet) and power amounts to 6 MJ per kg or 2582 Btu per lb of sugar produced, using the gross calorific value of fuel. With a sugar output of 14.5% on beet, being 85% extracted of 17% sugar in beet, this equates to 2.96 % on beet of "standard fuel" of 7000 kcal/kg or 12650 Btu/lb gross CV.
Fuel for direct fired pulp drying is additional to the above, typically an additional 50%.
The arrival of steam drying technology is starting to increase the attention paid to the fuel consumption for drying, as this large additional fuel cost can be virtually eliminated.
3. Technologies Used
European and American beet factories use broadly similar equipment and there is a healthy trade in ideas and equipment across the Atlantic. Features of the more efficient factories include:
- Heat recovery from vacuum pan vapour / condenser water, condensate and other sources
- Evaporator design with minimal vapour loss to condenser
- Falling film evaporators operating at low temperature difference
- Use of continuous vacuum pans to allow operation on 4th or 5th vapour
- Larger, more efficient sugar centrifugals
- Energy monitoring and management programmes, minimising process water addition
- Pulp pressing to 28 - 34 %DS using large screw presses
- Steam driers using vapour in evaporators
- Using boiler flue gases in pulp driers or for preheating combustion air
- High pressure boilers to 1300 psi for maximum power generation at low steam demand
Each of these could be the subject of a paper, however I will concentrate on the area of heat recovery and particularly on the design parameters for heat recovery systems.
4. Design of Heat Recovery Systems
The most widely used method for design of heat exchanger networks is Pinch Analysis, primarily developed by Linnhoff. This is a systematic analysis that can be applied to any process or factory to identify opportunities for improvement. [Linnhoff, B. Process Integration for the Efficient Use of Energy, IChemE, 1994 ISBN 0 85295 343 7]
In a sugar factory, beet or cane, pinch analysis can be used to identify the best way to recover heat from the hot streams leaving the process. For a beet factory these hot streams include:
- Vacuum pan vapour, at 50 - 60 °C condensing temperature
- Evaporator condensate, initially at 90 - 105 °C
- Carbonatation vent gases, at ~80 and ~90 °C
- Boiler flue gas, initially at 170 - 200 °C
These hot streams are matched to cold streams such as raw juice, diffusion water, boiler combustion air etc to maximise the recovery of heat that would otherwise be wasted.
Pinch methods are also used to develop the optimum use of evaporator vapours. It is beyond the scope of this paper to fully explain Pinch Analysis but there are some key concepts that we need to understand. These are "minimum approach temperature" and "area / energy trade-off".
5. Minimum Approach Temperature
The minimum approach temperature or MAT is the smallest temperature difference that occurs in the heat exchanger network.
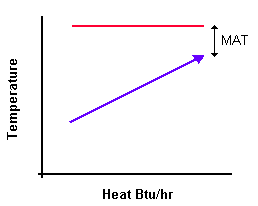 In a single counterflow heat exchanger the MAT occurs at the end of the exchanger where the fluid with the largest heat capacity flowrate enters the exchanger, for example in a steam heater as shown [right].
| | |
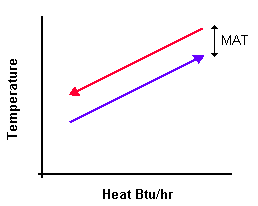 The "heat capacity flowrate" is the product of mass flow and specific heat capacity and in SI units is usually expressed in kW/°C, or in US customary units MMBtu/hr/°F. If two streams have exactly the same heat capacity flowrate they would run parallel on a temperature vs enthalpy graph and have the MAT along the whole length of the exchanger [right].
| | |
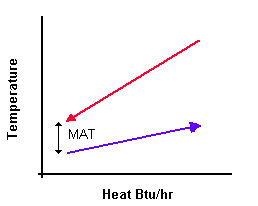 The more common situation is where two liquid flows of different heat capacity meet in a heat exchanger, for example raw juice and condensate as shown [right].
In this case the cold fluid (raw juice) has the bigger heat capacity flowrate so the MAT occurs at the raw juice inlet / condensate outlet end. With a suitably large heat exchanger the circulation juice from a diffuser at 70 °C can be used to cool evaporator condensate down to 74 - 80 °C, equivalent to a MAT of 4 - 10 °C.
|
6. Area / energy trade-off
The choice of MAT is usually an economic one - small heat exchangers have low capital cost while large MAT, large exchangers cost more but recover more heat by having smaller values of MAT.
Consider a heat exchanger using condensing pan vapour to heat cold raw juice from a tower diffuser. Assuming a juice temperature of 25 °C with the pan vapour condensing isothermally at say 55 °C, juice draft 110 %beet. The quantity of heat recovered varies with MAT as follows:
MAT
(°C) |
Juice Out
(°C) |
Heat Recovered
(steam %beet) |
LMTD
(°C) |
Exchanger Area
(ft² for 8000 tpd) |
| 4 |
51 |
4.69 |
12.9 |
7,680 |
| 8 |
47 |
3.96 |
16.6 |
5,038 |
| 12 |
43 |
3.24 |
19.6 |
3,492 |
| 16 |
39 |
2.52 |
22.3 |
2,396 |
Note how the exchanger area increases as MAT reduces - dropping from 16 to 8 °C recovers 57% more heat but needs more than twice the heat exchanger surface area.
In the European context MAT values of 5 or 6 °C are common. Using this example we can explore the economics of the different situations.
7. Fuel prices
Comparing fuel prices between countries is never easy, particularly where taxation is involved. The following data is drawn from a variety of recent publications and personal correspondence and is believed to be consistent:
|
Austria1 |
United Kingdom2 |
USA |
| Coal, US$ per million Btu |
n/a |
2.18 - 2.96 |
1.77 |
| Natural Gas, US$ per million Btu |
3.83 |
2.55 |
2.45 |
| Heavy Fuel Oil, US$ per million Btu |
3.40 |
2.76 |
2.57 |
| Electricity Purchases, cents/kWh |
9.0 |
6.7 |
2.4 - 4.7 |
| Electricity Sales, cents/kWh |
5.9 |
6.0 |
n/a |
- "Heat economy optimization ... at Hohenau sugar factory", Valentin et al, Zuckerindustrie 123 (1998) pp587-593
- "Energy Trends", UK Dept of Trade & Industry
Costs in the USA are lower, though the differences are not as large as is traditionally assumed by Europeans. They do not look large enough to justify the differences in energy efficiency.
8. Economic optimum MAT
Using the fuel prices and area / energy trade-off information allows us to see where the optimum value of MAT lies.
Assuming a 180-day campaign at 8000 tpd slice the energy savings of the pan vapour heat exchanger described in section 6 are:
MAT
(°C) |
Juice Out
(°C) |
Heat Recovered
(steam %beet) |
LMTD
(°C) |
Value of Energy Saving
($/annum) |
| 4 |
51 |
4.69 |
12.9 |
337,358 |
| 8 |
47 |
3.96 |
16.6 |
285,457 |
| 12 |
43 |
3.24 |
19.6 |
233,556 |
| 16 |
39 |
2.52 |
22.3 |
181,654 |
The savings assume a coal price of $1.77 per MMBtu and a boiler efficiency of 80% giving a steam cost of $5 per short ton.
If the total installed cost of the heat exchanger is $80/ft² a simple payback can be calculated:
MAT
(°C) |
Value of Energy Saving
($/annum) |
Exchanger Area
(ft² for 8000 tpd) |
Exchanger Cost
(US $) |
Simple Payback
(campaigns) |
| 4 |
337,358 |
7,680 |
614,384 |
1.82 |
| 8 |
285,457 |
5,038 |
403,030 |
1.41 |
| 12 |
233,556 |
3,492 |
279,395 |
1.20 |
| 16 |
181,654 |
2,396 |
191,675 |
1.06 |
This analysis can be made more sophisticated, for example the interest payments can be added to the capital and averaged over the project life. One can also consider the effect of campaign length and fuel costs, or different heat exchanger pricing. The reader is encouraged to do this exercise using his or her own assumptions, to see what value of MAT meets their economic objectives.
To identify an economic optimum, we will consider an interest rate of 10% and a project life of 10 years. For an initial capital outlay of $100k the total cost over 10 years is $200k and the annualised cost of capital $20k pa.
The annual fuel cost will be taken as the cost of heating the raw juice with no heat recovery, less the value of heat recovered. Plotting the annual fuel cost with the annualised cost of capital allows the optimum to be easily visualised:
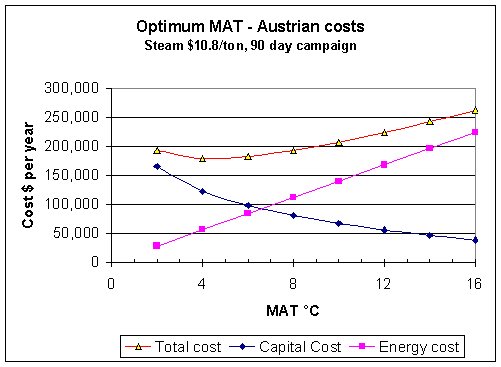
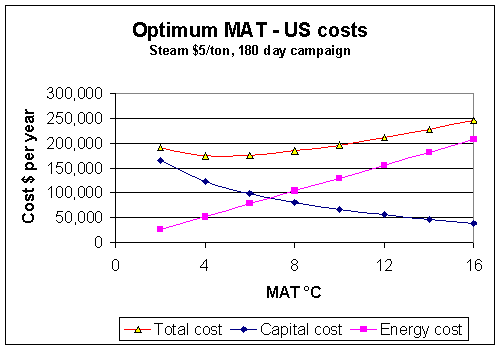
Both graphs show an optimum around 5 °C, which is perhaps not too surprising as the higher European fuel cost is offset by the US example operating the same heat exchanger for twice as many hours each year.
Adjusting the capital cost, the project life and the energy cost can move the optimum MAT from 4 to 20 °C or beyond. The graphs above illustrate the case with the full cost of steam and a high project cost of $80 per ft² of installed heat exchanger area.
European levels of efficiency can be seen to be appropriate to the USA, where longer campaigns compensate for lower fuel cost.
9. Application of MAT
The MAT concept can be applied throughout the factory energy systems, as it represents the economic optimum approach temperature in a heat exchanger. Each stage of thin juice heating, for example, should achieve an outlet temperature equal to the heating vapour temperature minus MAT. Methods are available to determine the optimum MAT for a whole process, the result is usually very similar to the single heat exchanger example used above.
In deciding what source of heat to use for a particular duty the MAT is a useful guide. If we wish to heat cold thick juice coming out of a storage tank the MAT concept would suggest the first heat source should be condenser water, then condensate or perhaps steam. It certainly wouldn't be 150 psi steam. In fact there is no need to use any boilerhouse steam in the beet sugar process other than exhaust steam to heat the evaporators, every other process heating duty can be done with pan vapour, hot water or evaporator vapour.
10. Practical implications
Designing for low MAT leads to larger surface areas in heat exchangers. To keep the heat transfer coefficient high, and the fouling low, a good velocity should always be maintained across the heating surface. This will lead to a higher pressure drop in a larger exchanger as the juice will effectively travel along a longer tube or plate passage.
Mathematically there is a relationship between the fluid pressure drop in a heat exchanger and the heat transfer coefficient. Just like there is an optimum MAT there is an optimum DP for a given heat exchanger which trades off extra pumping costs against reductions in capital cost or improvements in heat recovery. Typically the pressure drop per exchanger will be at least 10 psi.
An energy efficient beet factory will have higher pressure drops and larger heating surface areas than one that is less efficient, this is part of the price of efficiency.
11. Capital cost savings
When a beet factory expands there may be opportunities to improve its energy efficiency.
As well as reducing the operating cost this can also reduce the capital cost of the expansion, particularly where boiler capacity may be limiting.
A number of factory expansions in British Sugar have increased throughput by up to 50% without requiring any investment in boiler capacity. This can be particularly rewarding in the modern climate of environmental regulations. In a new factory expenditure in energy efficiency will reduce expenditure in energy supply, and may actually make a net saving in project cost.
12. Climate
The cold weather of the Red River Valley and similar areas results in a lower beet temperature and freezing of water within the beets. The additional heating and heat of fusion of ice have to be supplied in the factory diffusion system, which in a tower diffuser results in colder raw juice and an increase in circulation juice heater steam demand. With 30% of water in the beet frozen, and the beet at 0 °C, the additional heat requirement equates to some 7.5 %beet.
Pinch Analysis of beet factories usually identifies the condensing pan vapour as the pinch point in the heat exchanger system. This tells us that heating up to that temperature can be done with recovered waste heat, and above that temperature we may need to use evaporator vapour and steam. Assuming a cold juice temperature of 5 °C for the cold climate and 25 °C for a warmer climate, the extra 20 °C of juice heating represents an additional heat demand of 3.8 %beet. However all of this can be supplied from condensing pan vapour so it need not increase the factory steam demand at all. This assumes an appropriate heat exchanger system is installed.
With 3.8 %beet recovered as waste heat, of the additional 7.5 %beet the diffusion circulation juice heaters only have to make up the extra 3.7 %beet. It is this portion that is the true energy penalty for processing frozen beet when compared with beet at 10 °C. A good evaporator design would exploit the additional vapour demand to minimise condenser losses or to facilitate additional heat recovery from condensate, which may go some way to offset this penalty.
We would therefore expect to see a factory that achieves 25 %beet total steam in Europe running around 29 %beet in a frozen beet climate. Typical USA factories run around 44 %beet, an energy cost penalty of 50%. For an 8000 tpd factory over 180 days the extra fuel cost is $1 million pa.
13. Power generation
Electricity is always the most expensive form of energy, as its conversion from primary fuels in power stations is achieved at anything from 15 to 55% efficiency. Sugar factories can use their process as a heat sink to generate electricity at around 75% efficiency.
Power generation is most productive with high temperature and pressure steam fed into an efficient turbine. Practical turbine efficiencies range from 70 to 88 % and it is possible to retrofit an existing turbine with improved internals to achieve significant reductions in steam flow at a given power output.
Steam temperature tends to be limited to around 520 °C (970 °F) by materials of construction considerations - above that the superheaters become prohibitively expensive. If the boiler steam pressure is too high the exhaust of the turbine may become wet - 1300 psi is the maximum though most modern sugar factory boilers are 900 - 1050 psi.
The next chart plots power generation against steam demand for three turbine efficiencies and two boiler steam conditions - 900 psi 950 °F and 500 psi 720 °F :
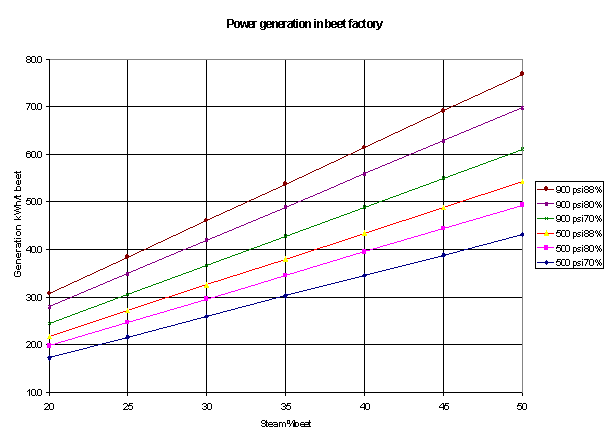
It can be seen that there is no overlap between the two steam conditions, so it is important to have a high pressure boiler if steam consumption is to be reduced to low levels and you wish to be self sufficient in power. This does not imply that it is economic to be self sufficient.
Some of the lower power prices quoted in the USA are around 2.4 cents/kWh. The energy cost of self generation is around 0.8 cents/kWh so the additional cost of importing 1 MW for 180 days is some $69,000. If the turbine steam rate is 20 lbs/kWh (500 psi boiler) the equivalent amount of steam is 20,000 lbs/h or 10 t/h costing $50/h to produce. Over 180 days the steam cost is $216,000 but the cost of replacing the power is only $69,000. In this situation it is worthwhile reducing the turbine output by making steam savings, providing power can be purchased at an appropriate rate.
14. Conclusions
The North American beet industry has lagged behind its European counterparts in energy efficiency, but the economics are very similar in the two cases. The long campaigns of North America give additional Btu savings for a unit investment in heat recovery and this offsets the lower fuel prices to give a similar return on investment.
Favourable power import prices allow steam savings to reduce power generation without compromising financial savings. The scope for following the European example and reducing energy consumption in the beet industry is significant, and the potential cost savings are large.


|